|
|
The Reports and Dashboards system provides several tools for filtering and displaying data:
· Interactive Calendar
· Filter Lists
· Page, View, Sort, Submit and Print Options
· Report Parameters Summary
Interactive Calendar
Reports and dashboards that require a date range or cut-off date display a calendar icon  next to the date field. Click the icon to display an interactive calendar for selecting a date. next to the date field. Click the icon to display an interactive calendar for selecting a date.
.png)
To change the month and year, use the arrow buttons:
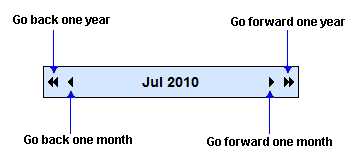
To select a date, simply click on it. This action populates the date field with your selection. Note that you can also click in the date field and type the desired date.
 or or .png)
Filter Lists
Several report and dashboard screens include drop-down list boxes for filtering data prior to generating the report or graph. Here are a few examples:
|
Use this filter
|
To...
|
|
.png)
|
Select a specific client, or all clients.
|
|
.png)
|
Select a specific eBillingHub user, or all users.
|
|
|
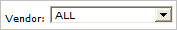
Select a specific eBilling vendor, or all vendors.
|
|
.png)
|
Select a specific invoice status, or all statuses.
|
|
|
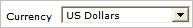
Select a specific currency. Only invoices of the selected currency will be included in the data.
|
|
|
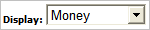
Select a specific filter for displaying data in terms of some value. For example, money or number of invoices.
|
|
|
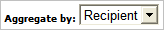
Select a specific filter for aggregating (grouping) the report data. For example, recipient, client, vendor, day, month, or year.
|
Page, View, Sort, Submit and Print Options
|
Use this tool or button
|
To...
|
|
.png)
|
View a specific number of data records in a list. For example, selecting "10" displays ten records in the list while selecting "All" displays all records in the list.
|
|
.png)
|
Page through a multi-page report. Click a page number to jump to that page.
|
|
|
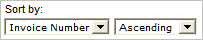
Sort the data by the selected value and in ascending or descending order. (Ascending order is low to high as in 1, 2, 3, 4 or a, b, c, d. Descending order is high to low as in 4, 3, 2, 1 or d. c. b. a.)
|
|

|
Generate or refresh the report or dashboard. Use the Submit button whenever you change a filter, date or sort order.
|
|
 or or 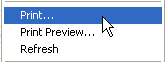
|
Print the report or dashboard using Internet Explorer's default print button, or by right-clicking with the cursor on the generated data to display and select the Print option. You can also export the report data and use external programs such as MS Excel, MS Word, and Adobe Acrobat to print the report or dashboard.
|
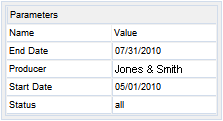
Report Parameters Summary
The report and dashboard display screen shows the date range and filter parameters used to generate the report or graph. These parameters are also exported when you export the data to MS Excel or MS Word, or save the data as an XML or PDF file. An example parameters summary is shown here:
Related Topics
.png) Exporting Report Data Exporting Report Data
Billing Reports
Collections Reports
Management Reports
|
|