|
This dashboard uses a graphical format to show a snapshot of eBilling volume over time. Billing activity includes the number of invoices processed through eBillingHub and the monetary amount of those invoices. When you select the Billing Activity Trends from the Management tab, the dashboard is generated automatically using default values. Follow the steps below to run the dashboard with different selection criteria.
Use the Billing Activity Trends dashboard to determine:
· How many invoices eBillingHub processed on a daily, monthly and yearly basis
· The monetary amount of invoices eBillingHub processed on a daily, monthly and yearly basis
· Trends in billing activity such as peak days of the week or peak months
To generate the dashboard, follow these steps:
1. Select Reports/Dashboards from the Reports menu.
2. Select Billing Activity Trends from the Management tab.
3. By default, the dashboard displays with the date range prepopulated as one year prior to the current date. To change the date range, click in the date fields and type the desired date.
4. Select a data display option:
|
Number of Invoices:
|
Displays the daily, monthly or yearly number of invoices processed through eBillingHub during the specified date range.
|
|
Billed Amount:
|
Displays the daily, monthly or yearly monetary amount invoiced during the specified date range.
|
5. Select how to aggregate the data:
|
Day:
|
By the number of invoices or total monetary amount invoiced on a daily basis. This option displays 60 days of data prior to the date in the To field.
|
|
Month:
|
By the number of invoices or total monetary amount invoiced on a monthly basis.
|
|
Year:
|
By the number of invoices or total monetary amount invoiced on a yearly basis.
|
6. Click Refresh to generate a graph based on your selections. Example graphs for both display options are shown here.
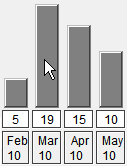 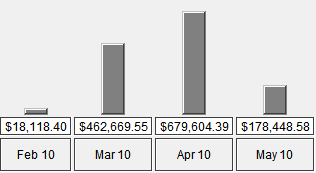
Number of Invoices Billed Amount
7. Double-click on a bar to see detailed billing transaction data for the displayed day, month or year. The following table describes the transaction data report columns:
|
Column
|
Definition
|
|
Ref #
|
A unique reference number assigned by eBillingHub each time an invoice is processed through Billing Wizard or Quick Invoice and submitted.
|
|
Tran Date
|
The transaction date when the invoice was submitted by the Billing Wizard or Quick Invoice.
|
|
Invoice
|
A unique number from the firm's Time and Billing system that identifies the invoice.
|
|
Date
|
The date the invoice was posted in the firm's Time and Billing system.
|
|
Start Date
|
The first day of the billing period for the invoice.
|
|
End Date
|
The last day of the billing period for the invoice.
|
|
Total Due
|
The total amount of all fees and expenses associated with the invoice.
|
|
Matter
|
A unique number in the firm's Time and Billing system that identifies the matter associated with this invoice.
|
|
Client
|
A unique number that identifies a client.
|
|
Client Name
|
The name of the client associated with the invoice.
|
You can export the billing data to several formats. Click here for more information.
Related Topics
.png) Additional Management Reports Additional Management Reports
Report Tools and Tips
|